Advertisement
Financial Independence is the Greatest Civil Liberty!
To paraphrase President Kennedy, automatic features can be a rising tide that lifts all boats.
The title of this post comes from a presentation more than a decade ago given by Mellody Hopson of Ariel Investments.
A Mass Mutual study reminded me of that long-ago presentation when it described a study that reflected America’s cultural and economic diversity.1 More on that below.
2019 marks the 10-year anniversary of IRS regulations confirming how to deploy the automatic features included in the Pension Protection Act of 2006 (PPA 2006). While presenting at the 2019 NAPA 401(k) Summit recently, I responded to an audience question regarding the prevalence of automatic re-enrollment (what some call sweeping-in non-participants). I recounted how in my last plan sponsor role, we adopted automatic features prior to passage of PPA 2006. Our plan changes were ultra-aggressive, designed to:
- Raise the participation rate from less than 75 percent to more than 95 percent every year,
- Raise the percentage of participants receiving the full employer match from fewer than 60 percent to more than 95 percent every year, while
- Confirming to all workers that a financially-successful retirement is possible, and
- Ensuring a positive “spillover” – improved financial security while employed not just at retirement.
Starting April 1, 2007, our plan’s automatic enrollment features included:
- A default of 3 percent of pay applied to all who are not contributing (not just new hires) or contributing less than 3 percent of pay,
- Automatic escalation of 1 percent of pay applied to all participants contributing at least 3 percent of pay but less than 6 percent of pay, and
- Re-enrollment using those same defaults on April 1, 2008.
Starting April 1, 2009, our plan’s automatic enrollment features included:
- A default of 4 percent of pay, applied to all who are not contributing (not just new hires) or contributing less than 4 percent of pay,
- Automatic escalation of 1 percent of pay applied to all contributing at least 4 percent but less than 12 percent of pay, and
- Re-enrollment:
- April 1, 2010, increasing the default to 5 percent of pay for all contributing less than 5 percent of pay,
- April 1, 2011, increasing the default to 6 percent of pay for all contributing less than 6 percent of pay, and
- Applying automatic escalation of 1 percent of pay to all contributing at or above the default but less than 12 percent of pay.
As I recounted in my NAPA presentation, we did get a few complaints: “How many times must I tell you that I don’t want to participate in this plan?” The automatic response was: “Just once a year.”
Automatic Features Lift All Boats
In 2008 and again in 2011, Ariel Investments and Hewitt Associates (now part of Aon) conducted studies on participation disparities by race and ethnicity.2 My plan participated in the first study measuring participation as of Dec. 31, 2007. We did not participate in the second study. So, we were able to compare the impact of our first step in the perennial deployment of automatic features. Here are some of those first year results:
- Number of employees contributing increased from 26,192 to 32,609 (a 6,417 increase) to reach the goal of 95 percent of eligibles partcipating.
- The average deferral percentage increased from 5.8 percent to 6.8 percent.
- Participation by age:
- Employees younger than 30: Participation increased from 59 percent to 90 percent, up 53 percent.
- Employees in their 30s: Participation increased from 75 percent to 94 percent, up 25 percent.
- Employees in their 40s: Participation increased from 79 percent to 96 percent, up 22 percent.
- Employees in their 50s: Participation increased from 81 percent to 96 percent, up 19 percent.
- Employees 60 and older: Participation increased from 78 percent to 93 percent, up 19 percent. - Participation by wage:
- Employees who earned less than $20,000 annually: participation increased from 41 percent to 72 percent, up 76 percent
- Employees who earned between $20,000 - $29,999 annually: participation increased from 58 percent to 93 percent, up 77 percent.
- Employees who earned between $30,000 - $39,999 annually: participation increased from 70 percent to 95 percent, up 36 percent.
- Employees who earned between $40,000 - $49,000 annually: participation increased from 79 percent to 97 percent, up 23 percent.
- Employees who earned between $50,000 - $69,999 annually: participation increased from 85 percent to 98 percent, up 15 percent.
- Employees who earned more than $70,000 annually: participation increased from 91 percent to 99 percent, up 9 percent. - Participation by gender:
- Contributing employees: 94 percent of the female employees and 95 percent of the male employees contributed.
- Average contribution rate (excluding non-savers): female employees contributed 6.0 percent of pay and male employees contributed 6.6 percent of pay.
- Average percentage allocated to equities: female employees allocated 61 percent of assets to equities and male employees allocated 68 percent.
But what really surprised me wasn’t the highly-favorable impact on improving contribution rates – raising rates among younger, lower-paid, shorter-service, and/or female employees. I had not anticipated that automatic features would, over time, reduce and all but erase racial and ethnic differences in participation, contributions, and equity investing. Here are the first year results, comparing my firm with all other firms that participated in the study:
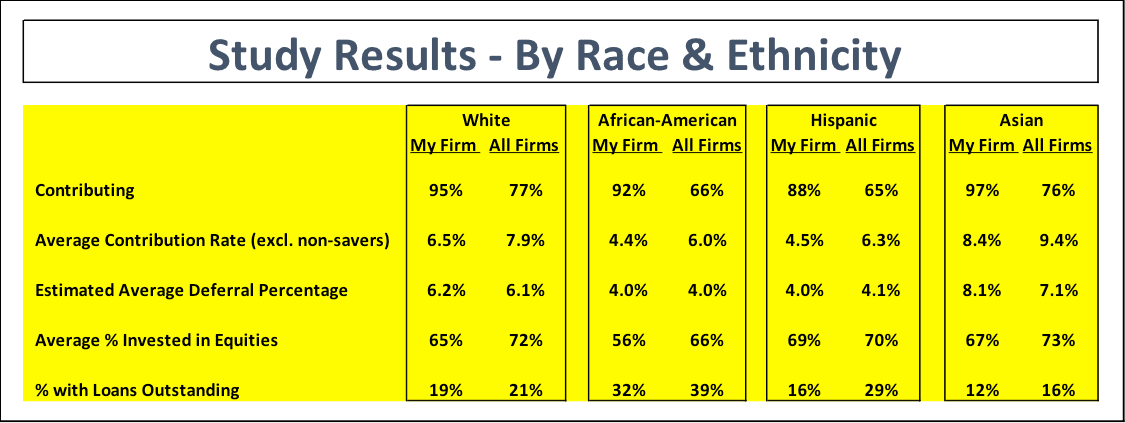
Observations: Automatically enrolling all non-participants, not just new hires, had four specific, obvious results:
- The higher rate of eligibles contributing,
- The lower average contribution rate (among those actually contributing), by sweeping in 6,417 non-savers, mostly at the 3 percent default,
- The minimal impact on our ADP test results (author’s estimates), and
- The lower allocations to equities as most who were automatically enrolled ended up in our Qualified Default Investment Alternative.
But, over time, as the default contribution rate was increased and as automatic escalation was applied, my plan’s contribution rates, allocations to equities, and ADP test results started to exceed those of most other retirement savings plans.
In my last plan sponsor role, my retirement savings plan had to meet the diverse needs of a population of more than 35,000 active workers and more than 15,000 term vested/retired employees – with varying financial priorities, financial status, economic, racial and ethnic diversity, ages, family and marital status, employment status, accumulated savings, and etc. Recognizing this, we made other changes designed to meet participants where they are – we coupled the ultra-aggressive automatic features described above with other changes in plan provisions, liquidity, aggregation/consolidation, and distributions designed to anticipate the diverse needs and financial priorities of the participant population.3 Over time, the automatic features we deployed have most assuredly lifted all boats.
1The American Dream Today: A Family Reality or Only Just a Dream? 2018 State of the American Family Study, Mass Mutual. “… We reached into the nation’s great cultural and economic diversity through individual market segments, different social groups and evolving family structures. … (We found) The top financial regret across all consumer groups is ‘not starting early enough.’ … Today’s families believe the American Dream involves three main priorities: Achieving financial security/independence, enjoying a comfortable retirement, and helping their children get an education. … The 2018 study reveals the five most common financial priorities: Having an emergency fund, being financially prepared for the unexpected, not carrying a lot of debt, feeling confident in both short and long-term financial decision-making and not living paycheck to paycheck. Accessed 4/9/19 at: https://www.massmutual.com/cm/family-study
2401(k) Plans In Living Color: A Study of 401(k) Disparities Across Racial and Ethnic Groups, 2009, Accessed 4/9/19 at: https://www.arielinvestments.com/images/stories/PDF/arielhewittstudy_fin... See also: 401(k) Plans in Living Color A Study of 401(k) Savings Disparities Across Racial and Ethnic Groups, The Ariel/Aon Hewitt Study, 2012, Accessed 4/9/19 at: https://www.aon.com/attachments/human-capital-consulting/401K_In_Living_...
3J. Towarnicky, My Financial Wellness Solution: The 401(k) as a Lifetime Financial Instrument, Society of Actuaries, 2017, Accessed 4/9/19 at: https://www.soa.org/essays-monographs/financial-wellness/2017-financial-...