Advertisement
Setting Savings Goals Through an Income Lens
As a plan sponsor, the aggregate savings needs of your employee population should be an important consideration in plan design. To gain perspective on these needs, let’s look at how an individual might think about savings goals.
When we ask ourselves how much we need to save for retirement, for most retirement savers, it boils down to quality of life. Save enough, and you can enjoy your retirement just the way you planned it. Don’t save enough, and at the end of your career your options are: extend your career into your golden years, save a lot very quickly, accept a standard of living in retirement that isn’t what you had planned, or some combination thereof.
The first option (where we saved enough) sounds a lot better, right? So how do we get there? This post discusses what a reasonable goal should look like and provides a few metrics to serve as guideposts for participants when determining a savings goal.
What Should The Goal Look Like?
There are a couple of commonly understood ways to measure retirement savings goals:
- Lump sum, measured by a single large number
- Inflation protected income, measured as level monthly or annual spending in retirement
Defining a Lump Sum Goal
A lump sum goal is a single dollar amount savings target. An example of a lump sum goal would be attempting to save $1,000,000 for retirement, which may sound like a lot. But is $1M a good goal? A better question is: how can we interpret what $1M means for your quality of life in retirement? Because we are conditioned to convert our annual income to quality of life expectations, a clearer way to understand if $1M is a reasonable goal is to convert it into income.
To estimate how much income $1M might provide, we can use the cost of income. In the hypothetical examples below, the cost of income is the price today to buy one dollar per year of inflation adjusted1 income for 25 years. In “Example A” it is estimated that $15 today will provide $1 every year for the next 25 years. By extension at that price, $1M, would result in $66,667 every year for the next 25 years.
| Example A | Example B | |
| Account Balance | $1,000,000 | $1,000,000 |
| Cost of Income | 15 | 25 |
|
Estimated Annual Retirement |
$66,667 | $40,000 |
Hypothetical examples provided for illustrative purposes only do not reflect actual investment results and are not guarantees of future results. Actual results will vary. Cost of income is never guaranteed and can vary over time. In these examples, Account Balance divided by Cost of Income = Estimated annual Retirement Income per Year for 25 Years.
Due to market forces, the cost of income varies over time. In the examples above, as the cost of income increases from Example A to Example B, the estimated annual retirement income decreases from $66,667 to $40,000 even though we have saved $1M in both scenarios. This shows us that variability in the cost of income can have a significant impact on estimated retirement income. It is not possible to know in advance what the cost of income at your retirement date will be, which makes using a lump sum goal (in our example, $1M) a moving target at best.
Defining an Inflation Protected Income Goal
The US Department of Labor says, “Showing participants their retirement plan account balance as level monthly payments for their lifetime will help them assess their retirement readiness and plan for their retirement.”2
An inflation adjusted income goal is like paying yourself a salary in retirement. In setting such a goal, we are estimating the amount of money we will need each month or year. Again, it is easier to understand goals in terms of income because we are already conditioned from our working years to convert our salary to expectations for quality of life.
Is 100% of My Pre-Retirement Income a Good Goal?
Your retirement income goals can likely be less than 100% of your pre-retirement income. Let’s look at a basic equation of income and savings during your earning years to find out why.
Pay Check - Taxes - Savings = Spending
Using the equation above and inventing some nice round numbers, let’s say pre-retirement an employee earned $50,000, paid $10,000 in taxes, and saved $5,000 each year: $50,000 - $10,000 - $5,000 = $35,000
Before retirement, the employee was only spending 70% of income ($35k spent out of an earned $50k).
The above equation changes in retirement. First, because saving for retirement would be a strange thing to do in retirement. Second, with no regular pay check, income taxes may be lower. Because of these changes, setting your goal at 100% of your pre-retirement income suggests you expect to spend more in retirement than when you were working.
This leads to a new question, should we shoot for the same spending pre and post-retirement, or do spending needs change in retirement?
How Spending Changes in Retirement
Your spending needs will change in retirement, the question is how much and which direction? Most aspiring retirees would point out that medical expenses seem a logical category to increase as we age. However, food (more time to cook at home), housing (paying off mortgage, downsizing after the kids move out), and taxes all have good supporting arguments to decrease in retirement. Fortunately, we don’t have to guess what the average answer may be. The Bureau of Labor Statistics compiled this information on its consumer expenditure survey, and even made the following handy chart for us:
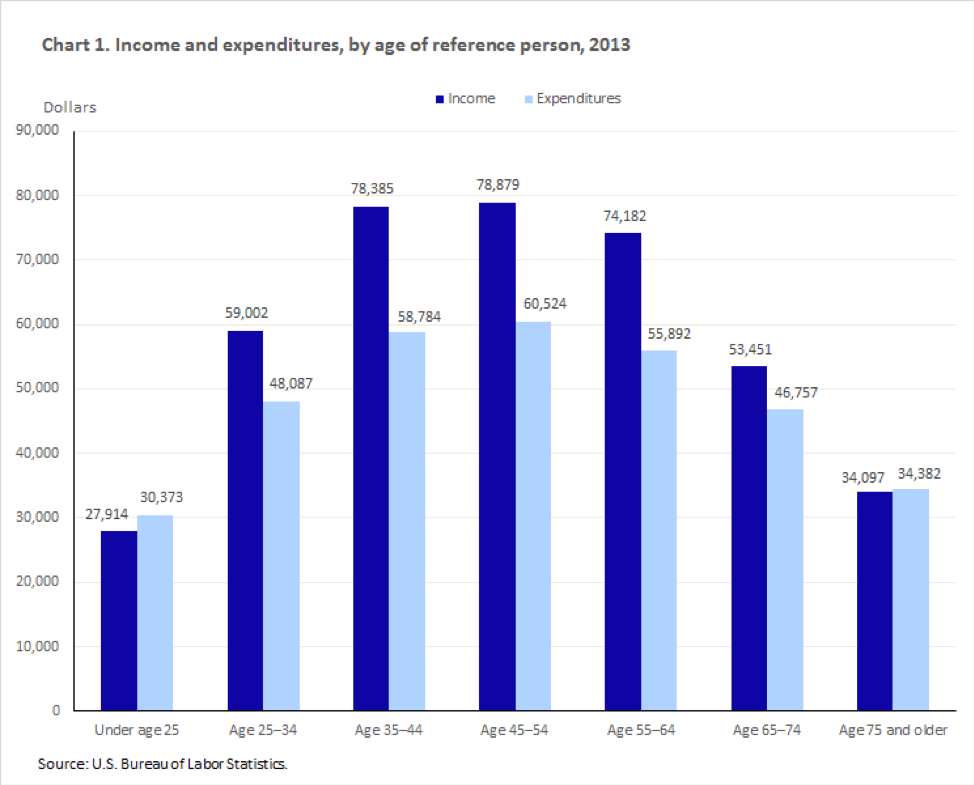
You can check out the full BLS article this came from if you like3, but here are some other summarized findings:
- Generally, consumer spending was “hump-shaped,” peaking around late 40s/early 50s.
- Healthcare expenditure both in dollar amount and as a percentage of total spending increased with age.
- Pretty much everything else (entertainment, transportation, taxes, food, etc.) followed the above “hump-shaped” pattern and decreased in retirement.
This pattern may not apply to all equally. When sorting income levels, we see that families with lower income tend to have a flatter expenditure hump. In other words, at lower income levels, spending is still expected to fall in retirement but not as much as shown above.4
Setting Your Goal
Hopefully you have seen that framing a goal in income terms is superior to a lump sum goal. An important first step in setting an income goal is spending some time with this equation: Pay Check - Taxes - Savings = Spending
Determining how much of your paycheck was spent over the last several years should give you a good baseline from which to establish a retirement income goal. Remember to adjust the estimate if you expect your income to increase between today and retirement. Furthermore, we saw in the data from the U.S. Bureau of Labor Statistics that spending decreases in retirement for the average family. While every family’s situation is different, the data may be helpful to zero in on a reasonable goal.
To track your savings progress against your goal, many retirement plan recordkeepers and investment managers now offer retirement income calculators (for example, my firm Dimensional5). It is also possible that pending legislation will require plan sponsors to estimate “lifetime income” on plan participant’s statements6.
Remember, how much to save boils down to quality of life: you are balancing quality of life today with the future. Saving early and adjusting your savings as needed should provide the financial resources to retire just the way you planned.
Plan Sponsor Perspective
Measuring a plan’s aggregate retirement readiness is a function of current savings and ultimate needs. Just as plan participants should measure their goals in income, plan sponsors should likewise evaluate the overall plan in terms of income.
Much of this post draws from work done by Marlena I. Lee, PhD and her paper The Retirement Income Equation7. Marlena and I both work for Dimensional Fund Advisors. Stay tuned for additional research and tools that can help plan sponsors evaluate a plan’s overall retirement readiness.
Steve Kosoris is a Vice President at Dimensional Fund Advisors in the Global Client Group.
Disclosures: This article is distributed for informational purposes, and it is not to be construed as an offer, solicitation, recommendation, or endorsement of any particular security, products, or services.
Dimensional Fund Advisors LP is an investment advisor registered with the Securities and Exchange Commission.
Dimensional Founder and Executive Chairman David Booth and Dimensional’s Head of Defined Contribution Sales Tim Kohn chair the PSCA Investment Committee.
Tim is also a member of the PSCA Board of Directors.
1Inflation adjusted means that as inflation occurs, the income stream would adjust to compensate for the increase in cost of living.
2U.S. Department of Labor, Employee Benefits Security Administration, Lifetime Income Calculator, Accessed 5/27/19 at: https://www.dol.gov/agencies/ebsa/laws-and-regulations/rules-and-regulat...
3Anne C. Foster, Consumer Expenditures Vary By Age, Accessed 5/27/2019 at: https://www.bls.gov/opub/btn/volume-4/consumer-expenditures-vary-by-age.htm.
4Rand Corporation Health and Retirement Study, waves 1-9 and HRS CAMS 2001-2009.
5Dimensional, My Retirement Income Calculator, Accessed 5/27/19 at: https://us.dimensional.com/defined-contribution/retirement-calculator A. Munnell, The Retirement Enhancement and Savings Act is back — and it does some good things, 3/21/18, Accessed 5/27/19 at: https://www.marketwatch.com/story/the-retirement-enhancement-and-savings...
6Marlena Lee, “The Retirement Income Equation,” DC Dimensions (Summer 2012).